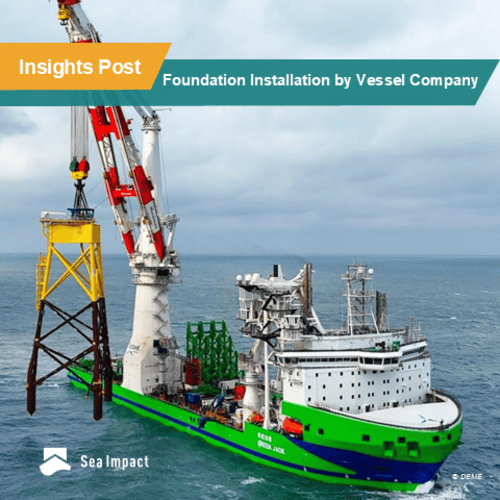
Hit enter to search or ESC to close
Sea Impact - Offshore Wind Market IntelligenceSea Impact - Offshore Wind Market IntelligenceSea Impact - Offshore Wind Market IntelligenceSea Impact - Offshore Wind Market IntelligenceSea Impact - Offshore Wind Market Intelligence
  • Home
  • News
  • About Us
  • Map
  • Demo
  • Services
    • Bespoke Analysis
    • In-Depth Reports
    • Market Intelligence Platform
  • Contact

News

Weekly Graph

Sea Impact Weekly Graph – Week 8

Year-on-year O&M Jack-up Interventions Today, Sea Impact provides you with the year-on-year development in O&M jack-up interventions across the European offshore wind industry. There has…
Lars-Andre TobabenSeptember 8, 2020
Weekly Graph

Sea Impact Weekly Graph – Week 7

Durations of Foundation Installation 2017-2019 Our weekly #SeaImpact update: The offshore installation duration is one of many factors to consider when selecting a foundation type for an…
Lars-Andre TobabenSeptember 8, 2020
Weekly Graph

Sea Impact Weekly Graph – Week 6

Installation Cycles at Deutsche Bucht Our weekly #SeaImpact update: Did you know that it took only 8 installation cycles to install the 31 turbines at Deutsche Bucht? The…
Lars-Andre TobabenMay 28, 2020
Weekly Graph

Sea Impact Weekly Graph – Week 5

O&M Jack-Up Interventions in 2018 Our weekly #SeaImpact update: Did you know that 2018 had 350 O&M jack-up related interventions across 4374 turbine positions? The…
Lars-Andre TobabenApril 30, 2020
Weekly Graph

Sea Impact Weekly Graph – Week 4

Progress Curve Our weekly #SeaImpact update: Today, we zoom in and present you the progress curves from the installation at Arkona Offshore Wind Farm in…
Lars-Andre TobabenApril 23, 2020
Weekly Graph

Sea Impact Weekly Graph – Week 3

Vessel Benchmarks Our weekly SeaImpact update: Today, we present you the jack-up vessels' turbine installation performance between 2018-2019! What graph would you like to see…
Lars-Andre TobabenApril 16, 2020
Weekly Graph

Offshore Wind Installation Time

We bring you offshore wind installation time for WTGs across the global wind industry back to 2012. We look into the details and show the…
Lars-Andre TobabenApril 8, 2020
Weekly Graph

Sea Impact Weekly Graph – Week 1

Turbine installation Benchmarks Turbine installation times varies greatly across projects. See below our ranking of installation times for European projects. Follow us on LinkedIn for…
Lars-Andre TobabenApril 8, 2020
Announcements

Sea Impact is now available !

Sea Impact is proud to announce the market launch of its new offshore wind Market Intelligence Service, providing unprecedented performance insight across all offshore wind…
Suzy WuMarch 16, 2020
Previous 1 2
WindEurope Annual 2023

© 2023 Sea Impact - Offshore Wind Market Intelligence. All Rights Reserved. Privacy Policy

  • Home
  • News
  • About Us
  • Map
  • Demo
  • Services
    • Bespoke Analysis
    • In-Depth Reports
    • Market Intelligence Platform
  • Contact