INNOVATIVE PLATFORM

Offshore Wind Market Intelligence Platform

Our easy-to-use offshore wind market intelligence platform gives you instant access to hundreds of industry KPIs all based on real-world data. The platform provides deep insight through interactive charts, maps and other visualizations.

The most comprehensive Market Intelligence Platform for Offshore Wind that delivers KPIs and insight about installation and O&M
Offshore Wind Market Intelligence Platform

Access actual installation durations to input into your project schedule

Sea Impact helps you optimize your project schedules and budgets by providing real-world installation duration from over 75 offshore wind farms. Get access to P25, P50, P90 installation duration for any wind farm, WTG platform, vessel, foundation-type and more.

Choose the right installation contractors

Sea Impact has mined, processed and analyzed industry data and allows you to empirically evaluate the performance of potential subcontractors. Performance benchmarks for installation vessels and turbine manufacturers enable you to select the right installation contractors and give you ample knowledge going into any negotiation.

O&M life cycle cost assumptions

With the Sea Impact Market Intelligence Platform, you gain access to the major component failure rate for any operational turbine in any year of operation. With this platform, you can base your O&M cost models on a decade of industry-wide data.
Offshore Wind Intelligence

Key Applications of Our Market Intelligence

Offshore Wind Planning

Optimized project scheduling & budgeting

Improve Procurement

Key insights for installation contractor selection & negotiation

Optimize OPEX

Enhanced operational expenditure estimates

Data-Driven Decisions

Exercise project due diligence based on real-world data

Key Dashboards From Our Offshore Wind Market Intelligence Platform

Find a selection of our key dashboards and their applications. These dashboards and many more are included in our
offshore wind market intelligence platform

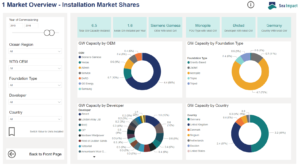
Market Overview – WTG installation

KPIs:

  • GW capacity by turbine OEM, vessel company, developer & country
  • Year-on-year development

Application:

  • Market sizing
  • Market share analysis
  • Market development

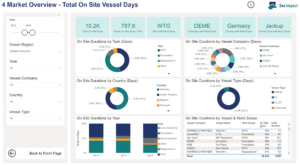
Market Overview – total on-site vessel days

KPIs:

  • Offshore days by task, vessel company, vessel type & country
  • Market share & size of foundation installation, WTG installation & jack- up O&M

Application:

  • Market sizing
  • Market share analysis
  • Market development

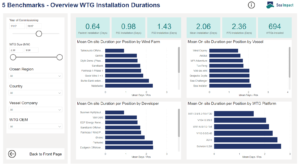
Benchmark – WTG installation durations overview

KPIs:

  • Industry averages, installation time / positions
  • Compare by projects, vessels, developers and turbine mode

Application:

  • Installation budgeting
  • Installation scheduling
  • Project Due diligence for installation
  • Project benchmarking (e.g. for LTAs)
  • Risk Management (P50 / P80)

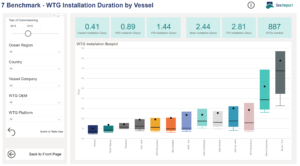
Benchmark – WTG installation duration by vessel

KPIs:

  • Min, Q1, median, means & Q3 installation duration by vessel
  • Compare by projects, vessels, developers and turbine model

Application:

  • Vessel company negotiations
  • Installation budgeting
  • Installation scheduling
  • Project due diligence for installation
  • Risk Management (P50 / P80)

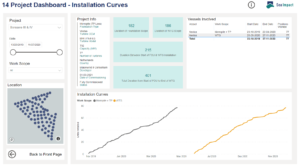
Project Dashboard – installation curves

KPIs:

  • Duration of packages
  • Float between packages
  • Installation performance

Applications:

  • Installation budgeting
  • Installation scheduling
  • Project due diligence for installation
  • Project benchmarking (e,g. for LTAs)
  • Risk Management (P50 / P80)

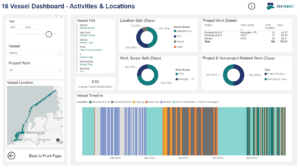
Vessel Dashboard – Activities & Locations

KPIs:

  • Vessel utilization rate
  • Vessel project history
  • Installation performance
  • Mean transit speeds

Application:

  • Vessel company negotiations
  • Vessel Availability
  • New vessel investments
  • Installation scheduling
  • Project Due diligence for installation

Modules

To ensure you only pay for what you need, we offer flexible access to our platform through our different modules.

Installation Module

Get access to all our installation dashboards. The dashboards include data from the installation of both foundations and WTGs at the over 80 wind farms installed since 2012.


Market Overview Dashboards

  • Size of foundation and WTG installation markets
  • Installation contractor market shares
  • Year-on-year market development
  • Total on-site vessel days

Benchmark Dashboards

  • WTG installation duration by OEM
  • WTG installation duration by wind farm
  • WTG installation duration by vessel
  • Foundation installation by type
  • Foundation installation by wind farm

Project Dashboards

  • WTG installation duration
  • Foundation installation duration
  • Installation curves
  • Vessel dashboards
  • Utilization overview

And many more…

Full Access Module

Get access to all current and future Sea Impact dashboards. The full access module gives you access to both the installation and O&M jack-up modules as well as the upcoming cable installation and SOV modules.


Market Overview Dashboards

  • Size of foundation and WTG installation markets
  • Installation contractor market shares
  • Year-on-year market development
  • O&M jack-up market size
  • O&M jack-up market shares

Benchmark Dashboards

  • WTG installation duration by OEM
  • WTG installation duration by wind farm
  • Foundation installation by type
  • O&M jack-up intervention durations by wind farm
  • O&M jack-up intervention failure rates

Project Dashboards

  • WTG installation duration
  • Foundation installation duration
  • Installation curves

Vessel Dashboards

  • Utilization overview
  • Individual vessel activities and locations

And many more…

Request info

O&M Jack-Up Module

Get access to all our O&M jack-up dashboards. The dashboards include data from over 100 operational wind farms for a combined 900 years of operational data.


Market Overview Dashboards

  • O&M jack-up market size
  • O&M jack-up market shares
  • Year-on-year market development

Benchmark Dashboards

  • O&M jack-up intervention durations by OEM
  • O&M jack-up intervention durations by vessel
  • O&M jack-up intervention durations by wind farm
  • O&M jack-up intervention failure rates

Project Dashboards

  • Overview of O&M jack-up interventions by project
  • O&M blade campaign overview

Vessel Dashboards

  • Utilization overview
  • Individual vessel activities and locations

And many more…

Request info

Cable Installation Module

Market Overview Dashboards

  • Inter-array cable installation
  • Export cable installation

Benchmark Dashboards

  • Cable installation durations overview
  • WTG installation duration by wind farm
  • Cable installation duration by vessel

Project Dashboards

  • Inter-array cable installation duration
  • Export cable installation duration

Vessel Dashboards

  • Utilisation overview
  • Individual vessel activities & locations

Request info

SOV Module

Market Overview Dashboards

  • O&M CTV & SOV Activity
  • Year-on-year development

Benchmark Dashboards

  • SOV performance comparison overview
  • SOV performance by wind farm
  • SOV performance by vessels

Project Dashboards

  • SOV & CTV activity

Vessel Dashboards

  • Utilisation overview
  • Individual vessel activities & locations

Request info