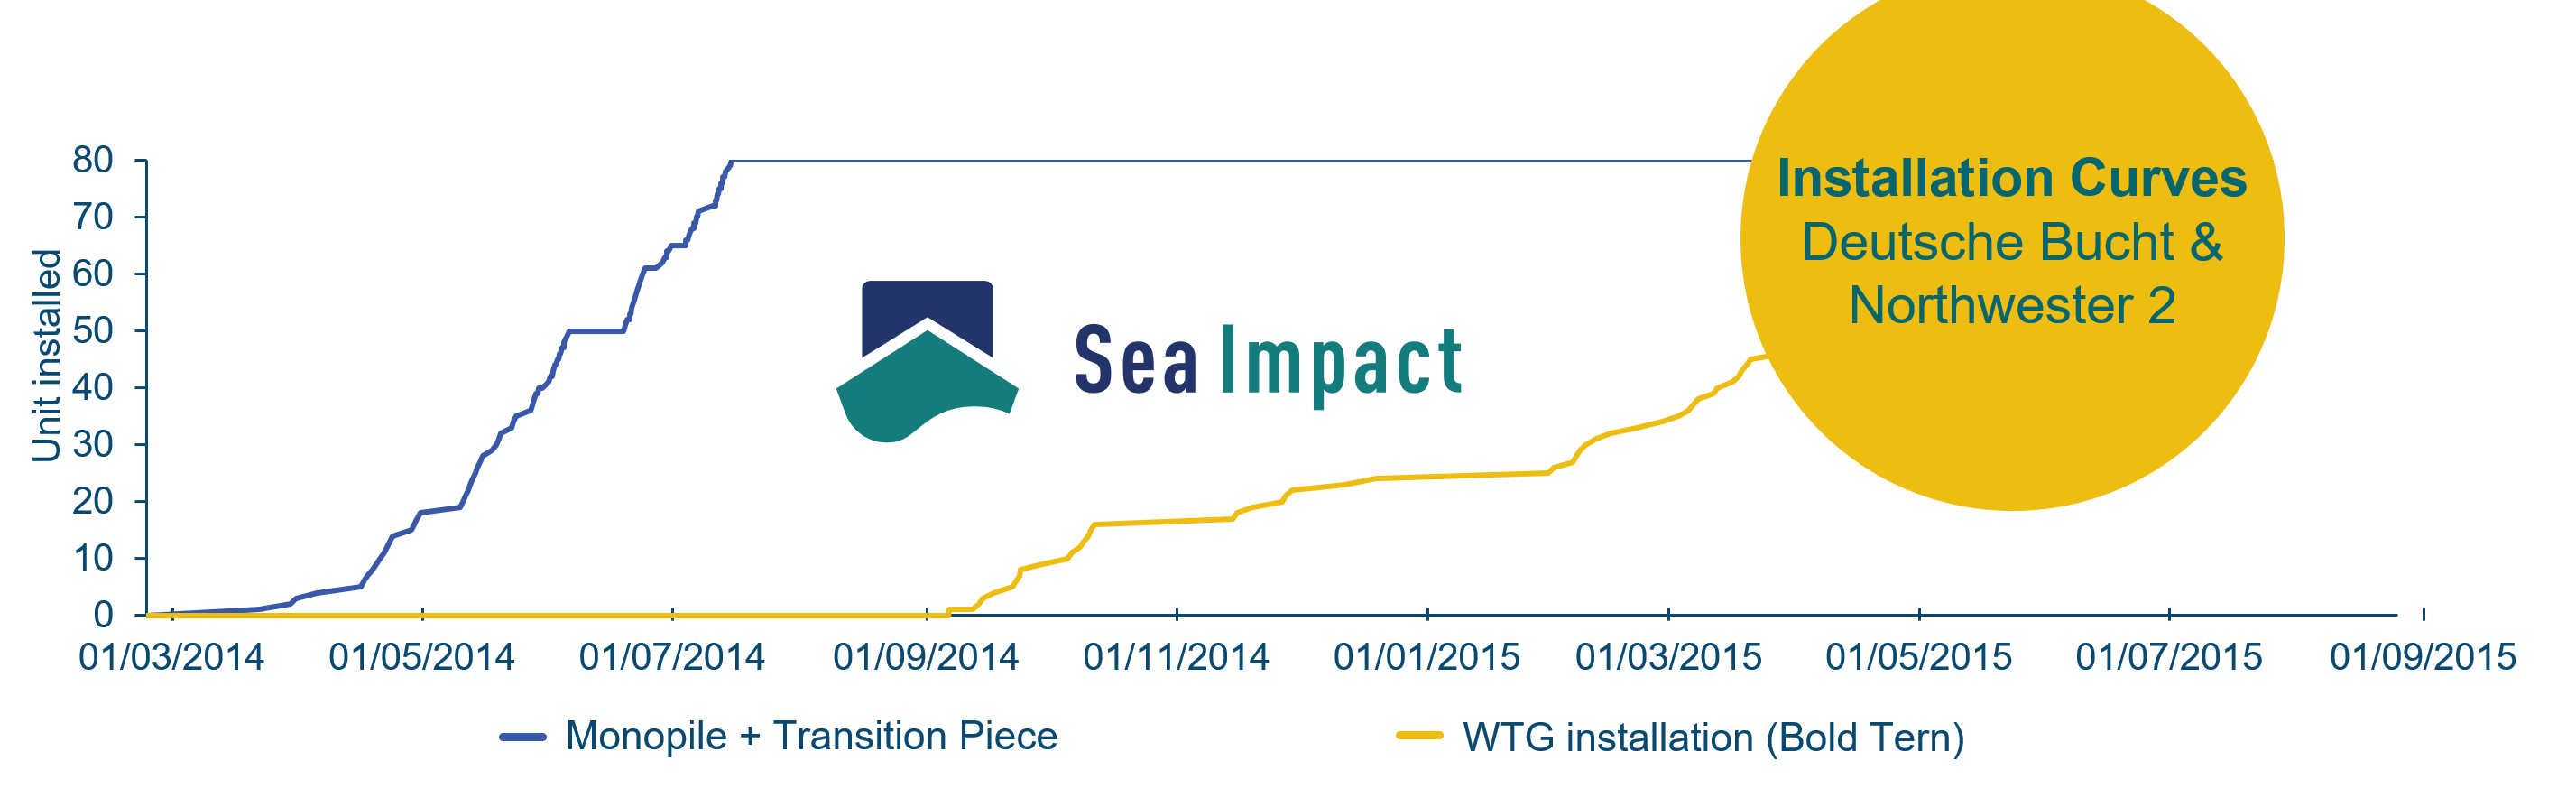
Installation Curves
Sea Impact Insight: How aggressively can you plan the float between the foundation and WTG packages? Our installation curve dashboard gives you an insight into float between packages, package durations and more for all wind farms constructed to date!
We provide you with a free snippet of the installation curves at Parkwind’s Northwester 2.
Are you interested in more installation curves or offshore wind insights? Reach out to our project manager Lars-André Tobaben at lat@sea-impact.com.
Try the interactive dashboard here.
Click the full screen mode in the bottom right corner for the best experience.
At Northwester 2, the float between the foundation package and WTG package was just 132 days. The wind farm was the first to feature MHI Vestas’s V164-9.5 MW turbine and the installation of the 24 turbines took 122 days. The project was commissioned in the summer of 2020.
What graph would you like to see next time?
Let us know in the comments below.
For more #offshorewindenergy benchmarks and insights, stay tuned here on https://sea-impact.com/ and follow us on LinkedIn.