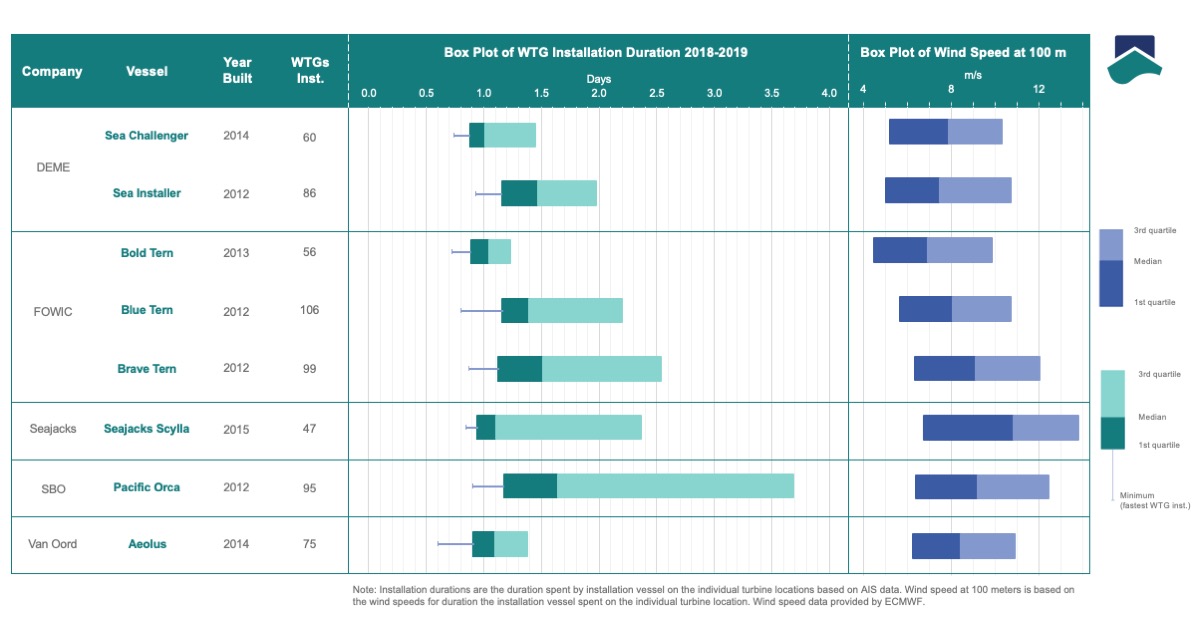
Hit enter to search or ESC to close
Close Search
Sea Impact - Offshore Wind Market IntelligenceSea Impact - Offshore Wind Market IntelligenceSea Impact - Offshore Wind Market IntelligenceSea Impact - Offshore Wind Market IntelligenceSea Impact - Offshore Wind Market Intelligence
Menu
  • Home
  • News
  • About Us
  • Map
  • Demo
  • Services
    • Market Intelligence Platform
    • Consulting Services
    • In-Depth Reports
  • Contact
  • linkedin
    Weekly Graph

    Sea Impact Weekly Graph – Week 3

    By Lars-Andre TobabenApril 16, 2020No Comments

    Vessel Benchmarks

    Our weekly SeaImpact update: Today, we present you the jack-up vessels’ turbine installation performance between 2018-2019! What graph would you like to see next week?

    Let us know in the comments below! For more OffshoreWind benchmarks and WTG insights, follow us here on LinkedIn our on https://sea-impact.com/

    #MarketIntelligence #OperationsManagement

    • Previous PostSea Impact Weekly Graph - Week 4

    • Next PostOffshore Wind Installation Time

    Recommended For You

    Weekly Graph Thor Wind Farm Installation Insight
    October 14, 2025

    Thor Wind Farm Installation Insight

    Lars-Andre Tobaben
    O&M Jack-Up Interventions by Turbine Size Weekly Graph How has the O&M Jack-Up Market been changing?
    August 26, 2025

    How has the O&M Jack-Up Market been changing?

    Beatriz Soares Eleutério da Silva
    O&M Jack-Up Interventions – H1 2025 Weekly Graph O&M Jack-Up Interventions – H1 2025 Update
    August 26, 2025

    O&M Jack-Up Interventions – H1 2025 Update

    Beatriz Soares Eleutério da Silva
    Share
    Share Share Share Pin

    © 2026 Sea Impact - Offshore Wind Market Intelligence. All Rights Reserved. Privacy Policy

    • linkedin
    Close Menu
    • Home
    • News
    • About Us
    • Map
    • Demo
    • Services
      • Market Intelligence Platform
      • Consulting Services
      • In-Depth Reports
    • Contact
    • linkedin