
Planning an offshore wind installation campaign?
Your duration assumptions may already be out of date.
In 2025, the industry median to install a single WTG hit 2.7 days — up 132% from 2020. In Europe: 2.41 days.
Here's what makes it worth a second look
For most of the past decade, turbines kept getting bigger and install durations barely moved. The industry absorbed the growth.
That’s no longer holding. The latest, largest turbines now do appear to be pushing durations up, a genuine shift from before.
Two drivers:
- Turbine size — average installed capacity grew from ~8 MW (2020) to ~12 MW (2025), and the newest units are where longer durations show up.
- The US effect — at 19% of 2025 installs, the US pulls the global median up. But that’s Jones Act feeder-barge logistics, not turbine size. It’s why Europe (2.41) sits below the industry figure (2.7).
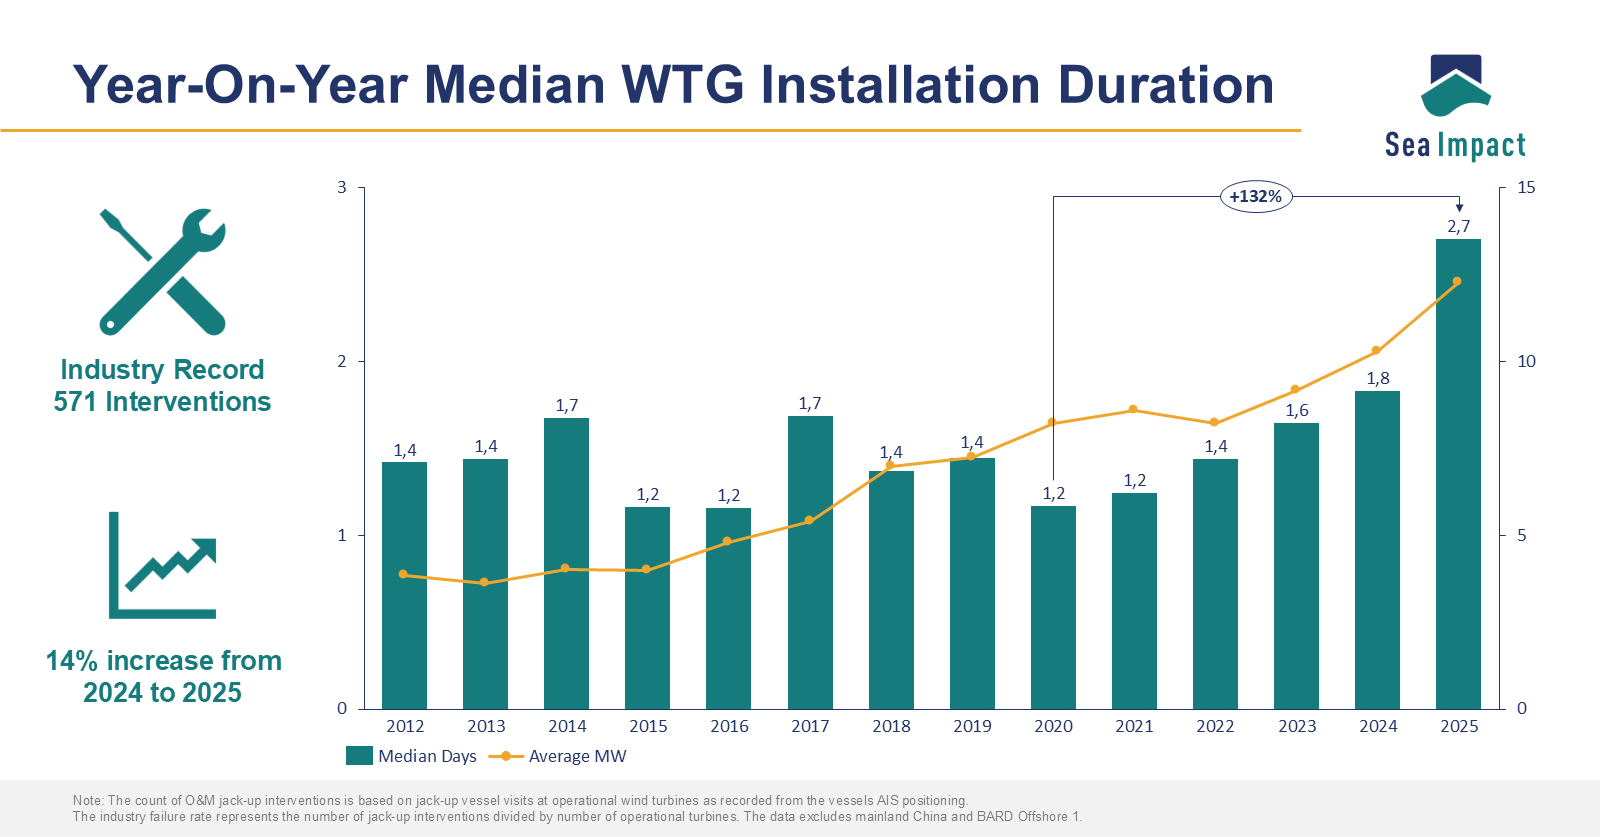
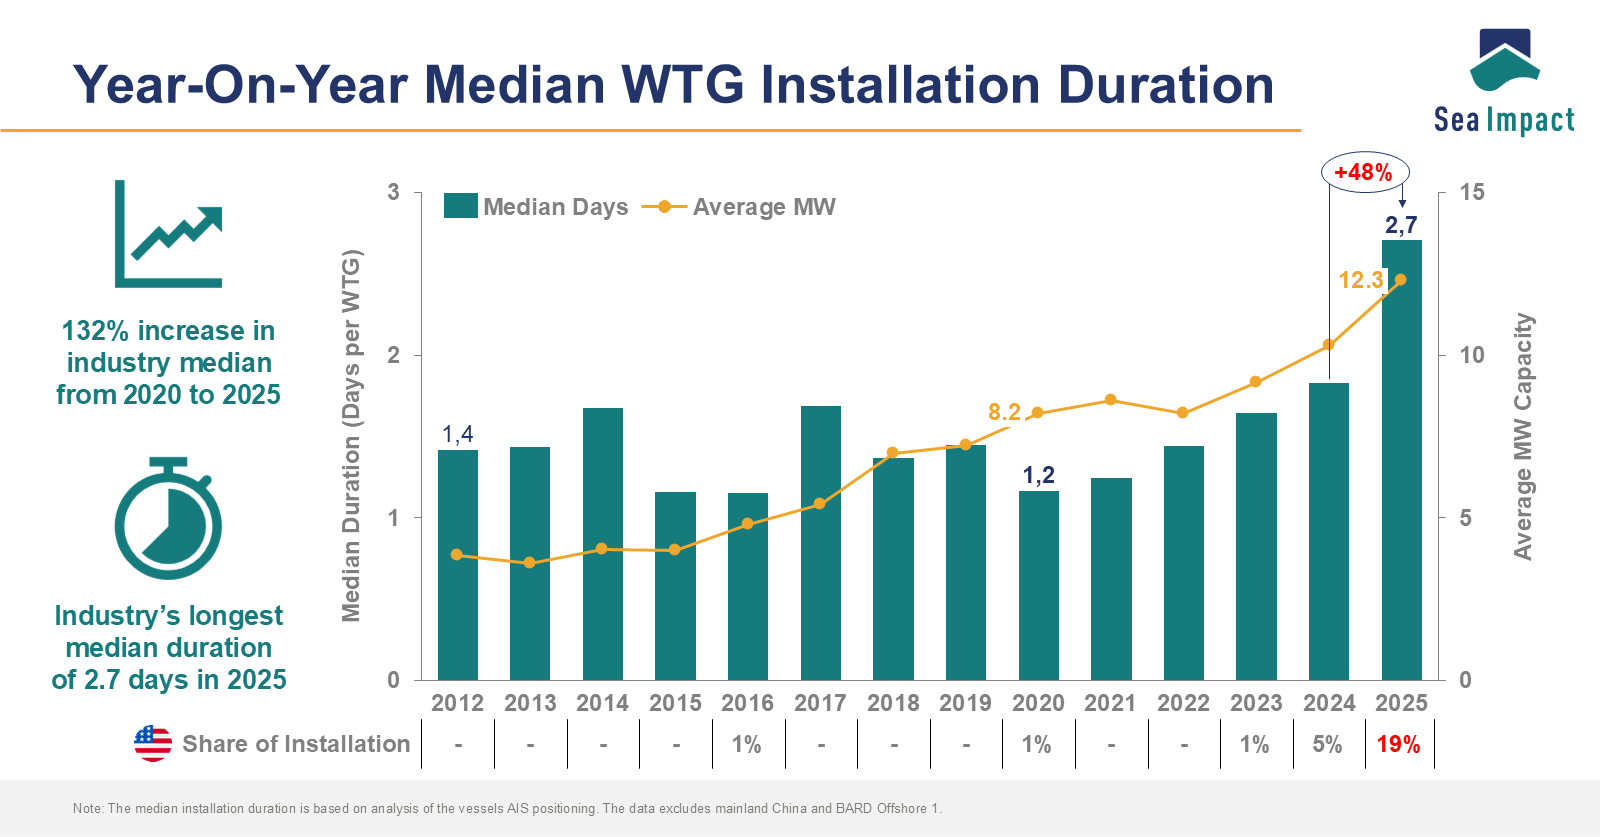
Note: durations show are on-position durations excluding China and BARD Offshore 1.
The Takeaway: review the durations in your plans — at the turbine-model level, because that’s where the differences now show up. A 2020 assumption on a 2025 turbine is schedule risk you don’t need to carry.